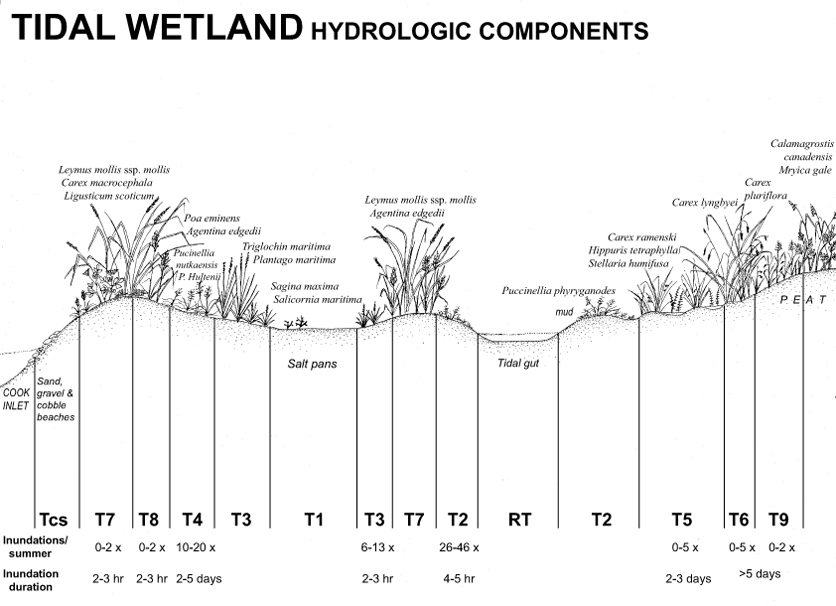
An idealized cross-section of a Tidal wetland showing mapping components and inundation frequencies and duration (Vince & Snow 1984). Artwork by Conrad Field
Range map showing the distribution of Tidal wetlands. Tidal wetlands are particularly concentrated at the mouths of larger rivers, in Goose Bay, and along the shores of Knik & Turnagain Arm
Tidal wetlands are found in areas inundated by tides at least annually. Tidal inundation varies over periods of days, months, years, and over an 18.6 year cycle. In Cook Inlet, which has a maximum of tidal range of over 10 meters, the differences between these different cycles is particularly evident. Vince and Snow (1984) described plant relationships along with the frequency and duration of tidal inundation on the tidal flats of the Susitna River, at the top of Cook Inlet. The hydrological components of Tidal wetlands correspond to the zones found by Vince and Snow (1984). Each zone is further characterized by one or a few plant taxa.
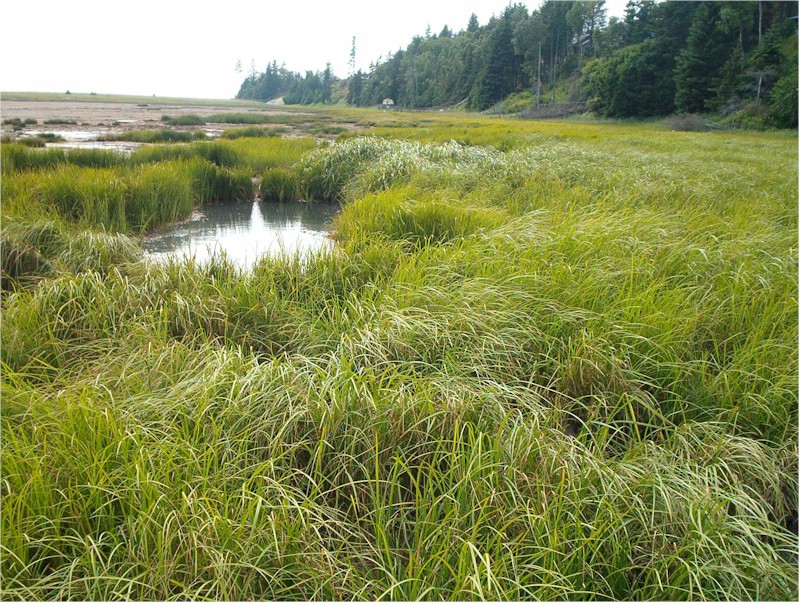
A Tidal wetland at the base of the Homer Spit looking from a T6 component in the foreground across a T5 component, to a T3 component in the middle distance. Tidal inundation is infrequent, but can be retained for several days in the T5-T6 zone which is characterized by the sedges Carex ramenski and C. lyngbyei respectively
NWI and HGM
NWI classifies most Tidal Ecosystem wetlands as E2EM1, Intertidal Emergent Persistent Estuaries. The few complexes with non-tidal wetland ecosystems (T9SA, T9K3 and T9, LB3), and some T9 map components fall into E2SS1, Intertidal Shrub-scrub Broad-leaved Deciduous Estuaries.
In the LLWW hydrogeomorphic classification of Tiner (2003), Tidal wetlands that are not found in estuaries are classified as Macrotidal Bidirectional Barrier Beach Fringe wetlands.The map unit: ‘Tcs‘ is a Macrotidal Bidirectional Bay Fringe wetland when immediately adjacent to Cook Inlet or Kachemak Bay.
Estuaries are variously classified. The wetlands in the lagoon north of Nikiski, and in Goose Bay are Macrotidal Bidirectional Fault-formed Tectonic Estuarine fringe wetlands. The wetlands in Beluga Slough and behind clearwater rivers and creeks are Macrotidal Bidirectional Bar-Built Estuarine Fringe wetlands. Finally, the estuaries behind the Kasilof and Kenai Rivers are most likely Macrotidal Bidirectional River channel Drowned River Valley Estuarine fringe wetlands.
Wetland Indicators
| Table 1. Tidal Ecosystem Wetlands | ||||
| Peat Depth (n=12) | Water Table (n=13) | pH (n= 11) | Specific Conductance (25°C; n=4) | Plant Prevalence Index (n=16) |
| 36 cm | 28.5 cm | 7.3 | 1152.8 µS | 1.53 |
Explanation:
- Peat depth is a minimum, because some sites had thicker peat deposits than the length of the auger used (between 160 – 493 cm).
- Water table depth is a one time measurement regardless of the stage of the tide or length of time since the last tide high enough to inundate the site.
- pH and specific conductance measured in surface water or a shallow pit with a YSI 63 meter calibrated each sample.
- Plant Prevalence Index calculated based on Alaska indicator status downloaded from the USDA PLANTS database, which may use different values than the 1988 list.
Soils and Plant Communities:
Soils are Typic cryaquents, the organic Clunie series, or “Tidal Flats”. For plant relationships see the idealized cross-sectional figure near the top of the page and Vince and Snow (1984).
- T0- Bare mud
- T1- Salt pans. Sparse, low glasswort (Salicornia maritima) and pearlwort (Sagina maxima).
- T2- Mud with creeping alkaligrass (Puccinellia phryganodes). Vince and Snow’s (1984) “Outer Mudflats zone 1”. Inundated 26-46 times per summer (mean=34).
- T3- Bare ground with goosetongue (Plantago maritima) and seaside arrowgrass (Triglochin maritima). Vince and Snow’s (1984) “Inner Mudflats zone 5”. Inundated 6-13 times per summer (mean=8).
- T4- Alkali grass (Puccinellia nootkaensis and P. Hultenii) dominates, usually with a beachrye (Leymus mollis ssp. mollis) component. Loosely follows Vince and Snow’s (1984) “Outer Mudflats zone 2” which is inundated 10-20 times per summer (mean=15).
- T5- Ramensk’s sedge (Carex ramenskii) dominates with pools. Mare’s tail (Hippuris), spikerush (Eleocharis spp.), saltmarsh starwort (Stellaria humifusa) found in and around the pools. Vince and Snow’s (1984) “Outer Sedge Marsh zone 3”. Inundated 0-5 times per summer (mean=3).
- T6- Lyngbye’s sedge (Carex lyngbyei) cover nearly continuous. Vince and Snow’s (1984) “Outer Inner Sedge Masrh zone 7”. Inundated 0-4 times per summer (mean=2). T6A is Lyngbye sedge mixed with alders.
- T7- Beachrye (Leymus mollis ssp. mollis) diverse plant community on storm berms. Probably in the same position as Vince and Snow’s (1984) “Riverbank Levee zone 6”, which is innundated 0-2 times per summer (mean=1). Vince and Snow did not include beachrye in their Susitna Flats plant zonation work, except to mention that it becomes more abundant above about 12 cm “relative altitude” (“…relative to about 10 m above mean low water of spring tides”).
- T8- Pacific silverweed, largeflower speargrass (Poa eminens) and sometimes circumpolar reedgrass (Calamagrostis deschampsioides) dominate. A combination of Vince and Snow’s (1984) “Riverbank Levee zone 6” and “Inner Mudflats zone 4”. Inundated 0-2 (mean=1), and 8-13 (mean – 11) times per summer, respectively. “Riverbank Levees” are often dominated by beachrye (Leymus mollis ssp. mollis).
- T9- Upper reaches of low gradient river mouths; dominated by manyflower sedge (Carex pluriflora). Vince and Snow’s (1984) “Inner sedge marsh zone 8”. Inundated 0-2 times per summer (mean=1).
- TL- “Tidal Lagoons” that are too small to map separate hydrologic components. Only one has been mapped, on the west side of the base of the Homer Spit. At other sites, such as Goose Bay, and the lagoon NE of Nikiski, separate hydrologic components can be mapped at the scale employed.
- TR- Along rivers or guts where more than two non-consecutive units at a scale too small to map. Typically formed where gradients are steep, such as along larger tidal guts or at mouths of large streams.
| Table 3. Summary of Cook Inlet Tidal map unit occurrence. | ||
| Map Unit | N | Acres |
| T0 | 22 | 217.3 |
| T0-4 | 3 | 30.7 |
| T04 | 4 | 84.9 |
| T05 | 1 | 1.8 |
| T07 | 2 | 16.2 |
| T1 | 3 | 13.2 |
| T1-4 | 3 | 74.9 |
| T13 | 2 | 338.0 |
| T14 | 2 | 55.7 |
| T17 | 1 | 67.6 |
| TIc | 1 | 2.0 |
| T2 | 1 | 0.8 |
| T2-4 | 2 | 26.0 |
| T23 | 3 | 23.7 |
| T29 | 1 | 10.4 |
| T3 | 21 | 98.1 |
| T3-5 | 4 | 68.8 |
| T32 | 2 | 3.8 |
| T34 | 5 | 61.3 |
| T35 | 4 | 33.2 |
| T36 | 1 | 0.4 |
| T37 | 2 | 1.3 |
| T38 | 1 | 66.1 |
| T4 | 13 | 684.2 |
| T4-6 | 3 | 38.6 |
| T40 | 1 | 30.0 |
| T41 | 4 | 31.8 |
| T42 | 2 | 14.6 |
| T43 | 13 | 164.5 |
| T45 | 2 | 82.1 |
| T46 | 2 | 67.5 |
| T5 | 47 | 954.2 |
| T5-7 | 1 | 3.3 |
| T51 | 2 | 28.3 |
| T53 | 8 | 337.3 |
| T54 | 2 | 78.9 |
| T56 | 10 | 213.5 |
| T58 | 2 | 76.8 |
| T6 | 27 | 363.4 |
| T6-8 | 2 | 22.9 |
| T64 | 1 | 6.2 |
| T65 | 17 | 346.5 |
| T67 | 8 | 112.8 |
| T69 | 9 | 489.3 |
| T6A | 1 | 43.2 |
| T6d | 1 | 1.8 |
| T6DW3 | 3 | 105.6 |
| T7 | 26 | 93.4 |
| T73 | 2 | 3.4 |
| T74 | 1 | 59.3 |
| T74d | 1 | 0.8 |
| T75 | 1 | 2.6 |
| T76 | 5 | 61.9 |
| T78 | 11 | 126.7 |
| T78d | 2 | 1.5 |
| T7c | 2 | 1.1 |
| T8 | 15 | 133.8 |
| T86 | 2 | 48.3 |
| T87 | 3 | 35.6 |
| T9 | 23 | 891.2 |
| T96 | 6 | 529.3 |
| T98 | 2 | 102.5 |
| T9K3 | 1 | 15.0 |
| T9LB3 | 1 | 62.5 |
| T9SA | 1 | 1.7 |
| T9SC | 1 | 2.3 |
| Tcs | 39 | 2789.2 |
| Tcsd | 1 | 7.7 |
| TL | 1 | 8.8 |
| TR | 36 | 1554.7 |