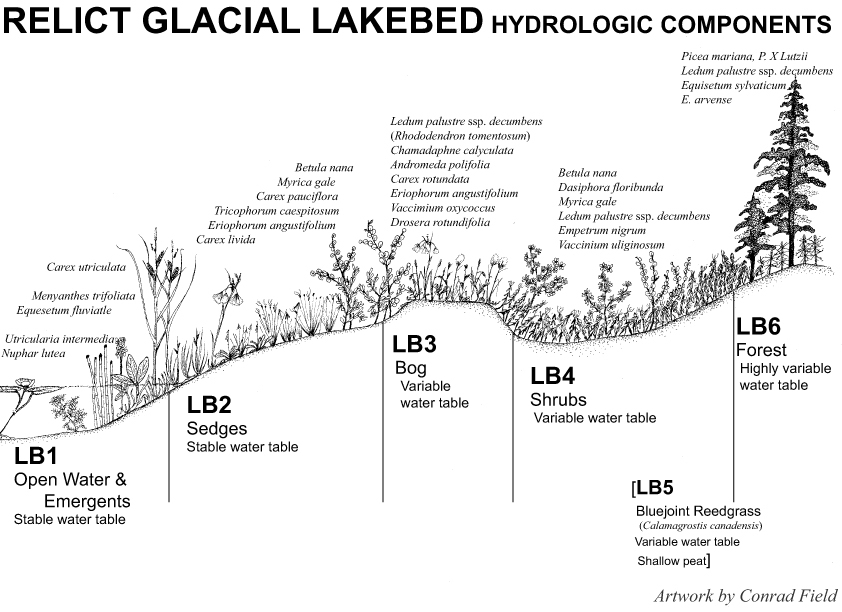
An idealized cross-section showing the Hydrologic Components and common plants of a Relict Glacial Lakebed wetland. Drawing by Conrad Field.
Range of wetlands mapped as Lakebeds.
Relict Glacial Lakebed wetlands are extensive peatland complexes occurring on expansive flat-to-gently sloping surfaces that formerly supported proglacial lakes. Peatlands develop on these surfaces through a process known as primary peat formation. In contrast to lake in-filling, the most familiar model of peatland formation, primary peat formation proceeds where peat builds up over large, flat marshy areas. The marshy areas occur where drainage networks are poorly developed, such as over relict glacial lakebeds, interfluvial areas on glacio-estuarine flats and at watershed divides where topographic relief is low. The original marshes may have been fed by ground water discharge that is recharged at distant features such as moraines or upland hills, or simply by ample precipitation, which drains slowly from the flat landform. Primary peat formation is the process responsible for most of the peat found worldwide.
In the Cook Inlet Lowlands, Lakebed peatlands are often interspersed fens and bogs. Patterning is often present, where low-lying pools, which can dry up seasonally to form mud-bottoms (flarks), are separated by intervening linear strangs (low shrubby ridges). The linear strangs are oriented perpendicular to porewater flow through the peat. Tree islands are common. Tree islands may indicate areas where bog peat is forming over fen peat. Bog formation is common in the Susitna Valley west and north of Houston, where bogs may form over a layer of fen peat, or directly over the underlying mineral sediments. However, bog water chemistry and plant indicators are almost completely absent from the Kenai Lowlands. The absence may be due to the steady supply of tephra (volcanic ash) to Kenai peatlands, unlike in the Susitna Valley. The tephra contains some calcium, which may inhibit germination of the sphagnum mosses that initiate bog formation. However, even as bog indicators are almost completely absent on the Kenai Lowlands, bog hydrology may be common in larger Kenai peatlands. Further investigation into peatland porewater interactions with the ground water in underlying glacial sediments is required before the full extent of peatlands exhibiting bog hydrology can be determined on the Kenai Lowlands.
Comparisons of 2005 satellite imagery with 1960 aerial photography in the Matanuska-Susitna Valley indicates that bogs and fens appear to be in stable equilibrium; neither the fens nor bogs appear to be expanding or contracting. Small mounds of sphagnum moss only meters in diameter are the same size and in the same position in 2005 as they were in 1960 (see images below). Bog mound extent is limited by hydraulic conductivity and distance to bounding streams; mounds typically develop on broad interfluves or at watershed divides with low topographic relief. The bogs may be stable because relict lakebeds in the photos support a drainage network sufficient to prevent bog mounds from enlarging. Alternatively, bog expansion in the Matanuska-Susitna Valley may be limited by the relatively low amount and pronounced seasonality of precipitation there compared to other regions of bog formation.
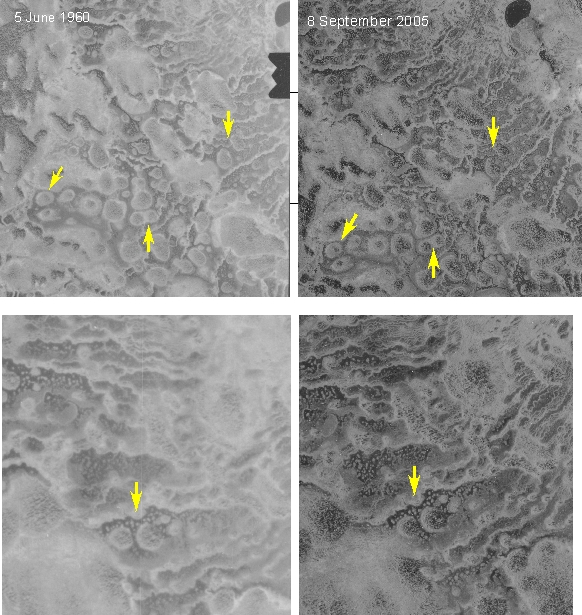
Bog islands in 1960 (left) and 2005 (right). Yellow arrows point to the same areas on both images. Note that the small light-colored dots, which are cushions of Sphagnum papillosum, an important bog initiator, are the same size and in the same position on both of the lower pair of images. The 1960 images are not ortho-rectified.
Relict Glacial Lakebed peatlands are larger than Kettles, which also form on abandoned lakebeds. The centers of large Lakebed peatlands are far removed from uplands, so surface water runoff originating from mineral sources appears distant. However, the mineral soil is never further than several meters away, beneath the peatland. Many fens, especially in the Matanuska-Susitna Valley, receive groundwater discharge from beneath, through sandy underlying lake sediments. Although the surface water chemistry of these peatlands may indicate bogs, the porewater chemistry in the peat a meter below the surface is frequently markedly different in this hydrogeologic setting. A bog may be present, but the bog peat may be restricted to a thin layer overlying a thicker layer of peat with fen porewater chemistry.
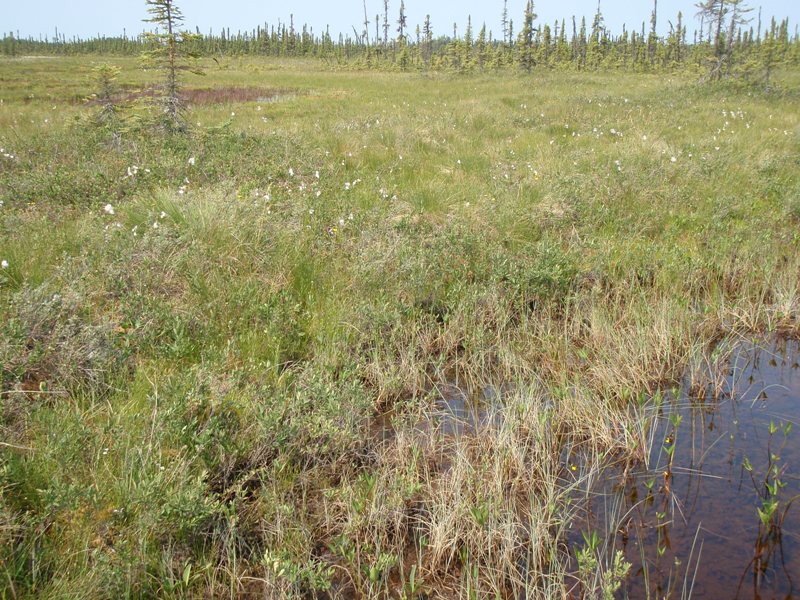
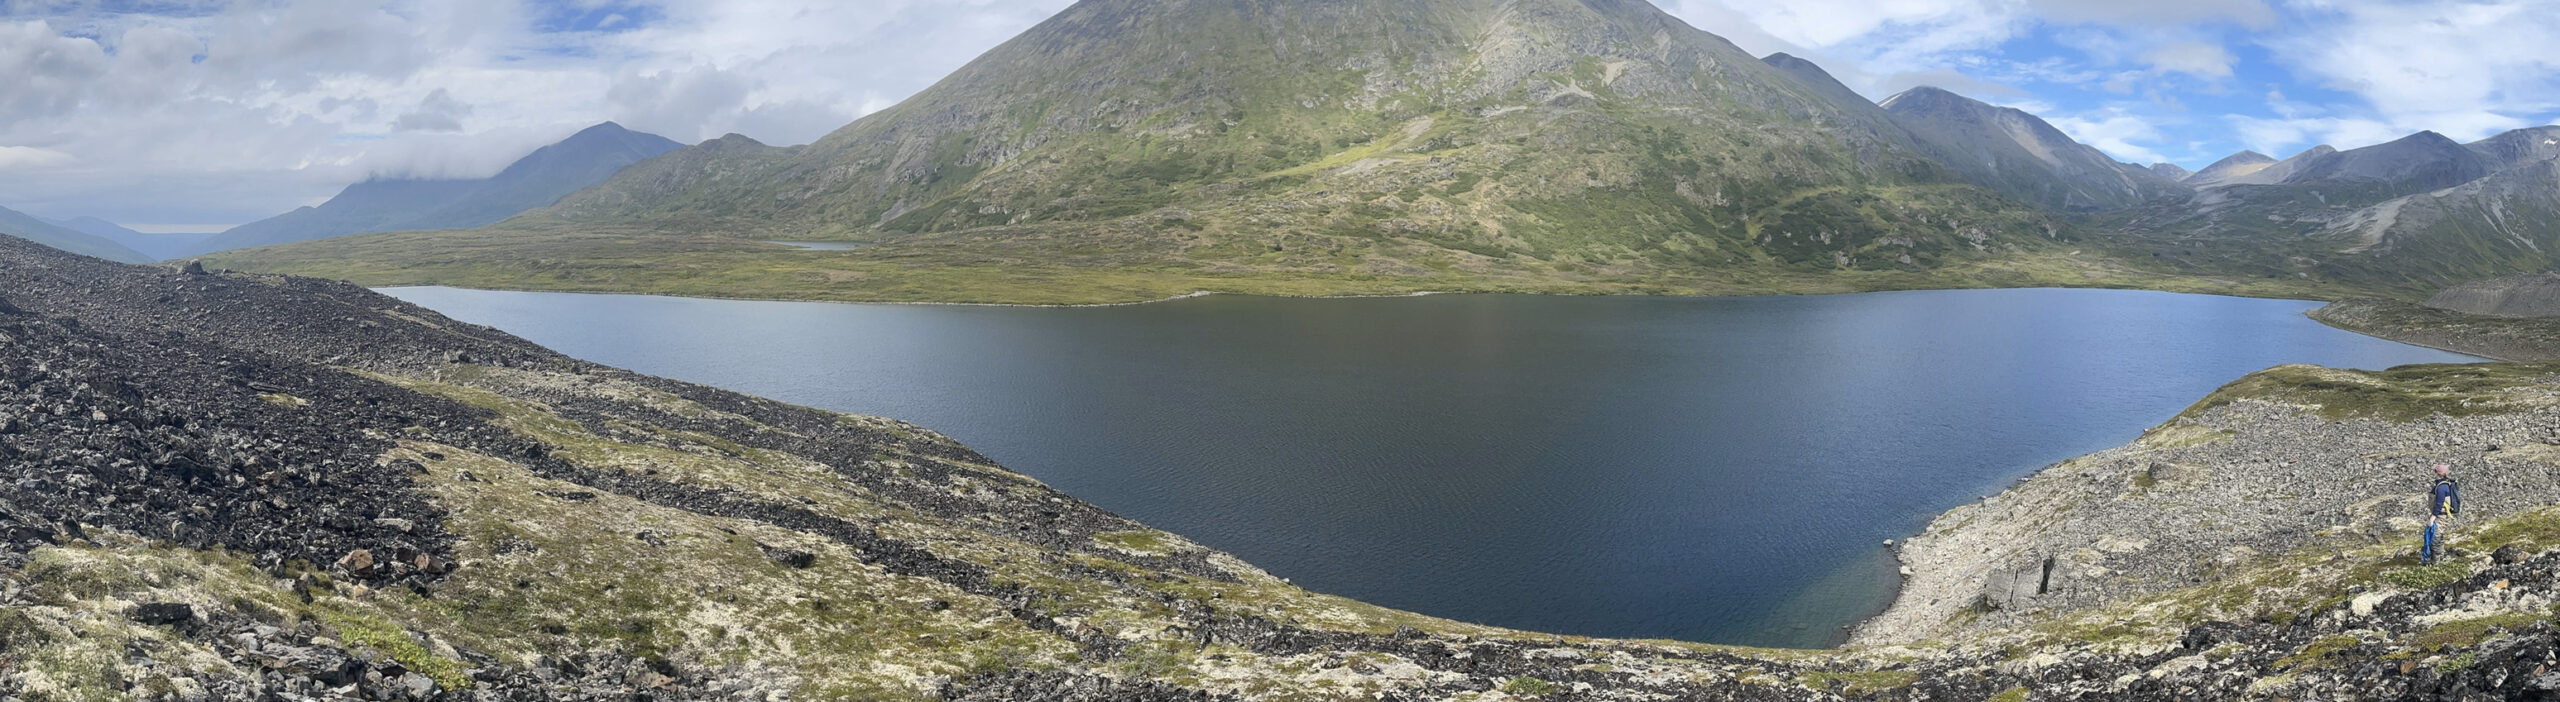
A Lakebed peatland north of Beaver Lakes. Patterning is evident with low-lying pools and sedge-dominated areas (right foreground and left-middle background), higher shrubby “strangs” (center), and tree islands (background).
Hydrologic Components of Drainageways and Lakebeds
Both the Relict Lakebed and Drainageway Geomorphic Components support six hydrologic components instead of the four that describe most of the other Geomorphologic Components (e.g. Kettles, Spring Fens, Depressions, VLD Troughs, and Headwater Fens). The hydrologic components for Lakebeds and Drainageways describe the same types, but are identified with different numbers. For example LB3 is the hydrologic component identifying a bog on Lakebeds, but DW5 is the hydrologic component identifying a bog on Drainageways; and LB5 is the hydrologic component identifying bluejoint reed grass on a Lakebed, while DW4 supports the same plant on a Drainageway. LB6 is a forest on a Lakebed, while DW5A is a forest on a Drainageway. These differences are due to the relationship of the components to the relative position and stability of the water table, which is different for Drainageways, whose porewaters receive ample groundwater inputs, than for Lakebeds, which receive a higher relative contribution from precipitation because they tend to have flatter gradients and underlying substrates that are less permeable. The hydrologic components attempt to describe relative wetness or dryness defined by the median position of the water table and its variability throughout the growing season. Therefore the same vegetation type (bog or Bluejoint) can grow in different relative positions on these different landforms. For example, a bog on a Lakebed (LB3) supports a higher water table with less fluctuation than the shrubby portion of a Lakebed (LB4), and a bog on a Drainageway (DW5) tends to support a deeper water table with more variation than the shrubby portion of the Drainageway (DW3) (see the figure: “Plant Prevalence Index in Common Wetland Mapping Components” below).
Hydrologic Function
Lakebed peatlands are large complexes composed of many elements that function differently. An element of the watershed is defined as a homogeneous area that functions differently from adjacent areas. Bogs are by definition recharge mounds, therefore elements on a Lakebed mapped with an LB3 hydrologic component in the Cook Inlet Classification support ground water recharge. There is evidence that the recharge from bog mounds may reach deep into the underlying mineral sediments. Bogs also store precipitation and contribute discharge to elements lying down-gradient. Areas of Lakebed peatlands mapped with the LB1 or LB2 components support stable water levels above or very near the surface throughout much of the growing season. Although significant storage capacity is available even when the water level is above the surface due to the elasticity of the peat aquifer, these elements most often function to transmit pore water to down-gradient elements of the wetland or directly to streams, when they are adjacent to them. Some streams originate in Lakebed complexes, especially those mapped as Rel, which are often formed over streambeds composed of peat. Areas of Lakebed mapped with the higher-numbered hydrologic components, LB4, LB5, and LB6, more frequently function to store precipitation, and contribute discharge to elements of the wetland lying down-gradient. Areas mapped with these hydrologic components more often support more variable water levels further beneath the surface (see the figure below, Plant Prevalence Index on Common Wetland Mapping Components). The deeper water level indicates that a larger volume of pore space is more frequently available for storage, and the variability shows that, once filled, the pores drain to down-gradient elements. A water budget analysis and a mixing model showed that Lakebed peatlands contribute over half of the stream flow to an anadromous tributary of the Anchor River one day during the summer dry period.
NWI and LLWW
Lakebeds are Palustrine wetlands in the US Fish and Wildlife Service’s National Wetlands Inventory (NWI) classification. Lakebeds support a variety of Classes from herbaceous emergents (PEM) to shrubs (PSS) and forest (PFO). The forested subclass is almost exclusively needle-leaved evergreen, but occasionally it is mixed needle-leaved evergreen / broad-leaved deciduous. The shrub subclass is usually a mix of broad-leaved deciduous and evergreen. Hydrologic regimes are generally saturated (B) in the shrub/scrub class (PSSB), although the seasonally flooded/saturated regime is often found where the PEM subclass (PEME) is encountered. The hydrologic regime in the forested or shrubby subclass often does not fit any of the NWI regimes very well because PFOs on Lakebeds rarely support standing surface water, and are only saturated to the surface for a sufficient time during the growing season to meet wetland conditions. Due to the short growing season in Cook Inlet Basin, this period of saturation may be only for a few weeks. The NWI hydrologic regime “saturated” requires saturation to the surface for “extended periods during the growing season”. The water chemistry modifier in Lakebeds is usually acidic, although where tephra deposition is chronic, or where ground water discharges to near the surface, cicum-neutral (pH > 5.5 in the Cowardin system) conditions may be present. On lakebeds, the soils modifier is always organic.
In the LLWW Hydrogeomorphic classification system of Tiner (2003) many Lakebeds fit loosely into the Terrene Flat/Slope groundwater-dominated throughflow category. In the Susitna Valley, Lakebed wetlands often support bog development. Bogs are Terrene Flat Outflow wetlands because they only receive water from meteoric sources, but they recharge adjacent fens, which are contiguous with the bog over the larger lakebed landform. Bog peat likely overlies a layer of fen peat on most Lakebeds. On the Kenai Lowlands bogs are difficult to identify due to the constant deposition of tephra. The tephra masks floristic and water chemistry indicators of bog hydrology. Although many of the peatlands that have formed over Lakebeds and other landforms on the Kenai Lowlands may function hydrologically as bogs, they will require a closer investigation of porewater interaction with ground water before they can be accurately identified.
Some Lakebeds may have once been created by paludification, but that process is probably not active in most Cook Inlet lowland peatlands because precipitation is too low and seasonally distributed. Many form the headwaters to small streams, particularly short-run streams near the coast.
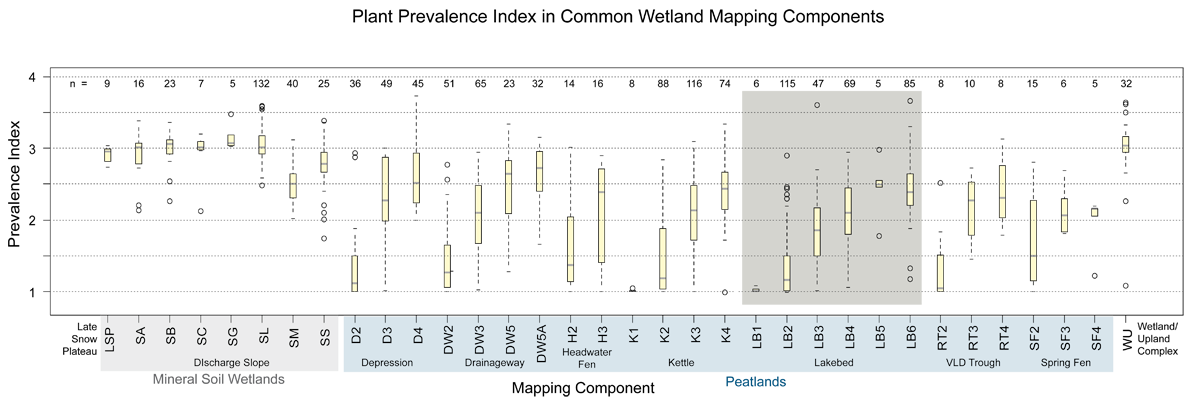
Box plots of Plant Prevalence Index in common Lakebed mapping components (highlighted in gray). Lower-numbered components have lower values for Prevalence Index, and higher-numbered components have higher values (for example compare LB2 with LB6). Ponds (LB1) almost exclusively support wetland obligate plants. Forested components (LB6) sometimes support Index values > 3. Bogs on Lakebeds (LB3) tend to support lower Index values (are wetter) than bogs on Drainageways (DW5). Lakebed bogs may be wetter because they tend to occur throughout these flat landforms, while bogs on the more linear landforms of Drainageways tend to occur along their margins, further from stronger groundwater influence. The marginal bogs on Drainageways tend to be forested, while bogs on Lakebeds are forested or open.
Prevalence Index is calculated from the percent cover and the wetland indicator status of each plant found in a wetland plot. Lower values indicate a higher prevalence of plants assigned a wetland indicator status of obligate or facultative. Indicator status is assigned nationally, by state, and by regions within states. Prevalence Index may be a better descriptor of the variability of the water table than one-time measurements of the actual position of the water table. Measurements are often made before the water table has fully equilibrated, and are dependent on antecedent conditions. However, if Indicator Status is accurately assigned the plants present will integrate long-term average conditions.
In the box plots, yellow boxes enclose the first through third quartile (where 50% of the data values lie); the gray bar is the median, and the whiskers extend to the last value within 1.5 times the inner quartile range. Values lying beyond 1.5 times the inner quartile range are plotted as hollow circles. The number of samples for each map component is given across the top.
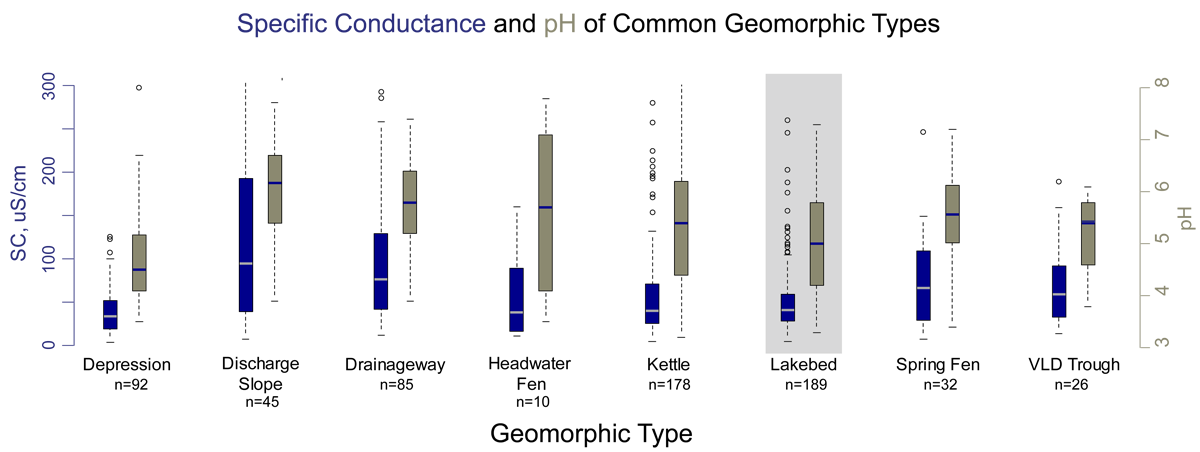
Box plots of specific conductance (blue) and pH (brown) on Lakebeds (gray). The median of pH is lower than in many other geomorphic settings, however a wide range values is also present. This wide range likely represents the differences between Lakebeds on the Kenai Lowlands, where chronic tephra deposition raises pH, and the Susitna Valley, where typical bog chemistry is more common on Lakebeds. Specific conductance is generally lower than in other geomorphic settings, reflecting greater contributions from precipitation, although the long tail of higher values suggests that ground water contributions from underlying mineral sediments occasionally reach the surface. Intermediate values are likely influenced by tephra on the Kenai Lowlands.
In box plots, the boxes enclose the first through third quartile (where 50% of the data values lie); the horizontal bar in the box is the median value, and the whiskers extend to the last value within 1.5 times the inner quartile range. Values lying beyond 1.5 times the inner quartile range are plotted as hollow circles.
Wetland Indicators
| Table 1. Wetland Indicators in Relict Glacial Lakebed map components throughout the Cook Inlet Lowlands. | ||||||||
| Map Component | Peat Depth (cm) | Water Table (cm) | Redox features (cm) | Saturation (cm) | pH | Alkalinity mg/l as CaCO3 | Specific Conductance µS/cm | Plant Prevalence Index |
LB1 |
241 (7) | -61 (10) | 0 (8) | 5.8 (18) | 3.3 (10) | 35 (19) | 1.02 (6) | |
LB2 |
188 (123) | 3 (112) | 108 (2) | 0.4 (69) | 5.3 (87) | 6.9 (60) | 55 (82) | 1.34 (114) |
LB3 |
183 (51) | 12 (40) | 7.5 (31) | 4.4 (34) | 0.1 (27) | 44 (32) | 1.85 (47) | |
LB4 |
130 (70) | 19 (65) | 55 (12) | 7 (20) | 5.3 (28) | 5.1 (13) | 61 (22) | 2.10 (69) |
LB5 |
95 (6) | 38 (6) | 15 (5) | 5.1 (4) | 8.0 (2) | 72 (3) | 2.45 (5) | |
LB6 |
99 (91) | 29 (75) | 49 (22) | 12 (31) | 4.7 (30) | 6.3 (18) | 64 (22) | 2.42 (60) |
Explanation:
- Numbers in parentheses indicate number of samples.
- Peat depth is a minimum, because some sites had thicker peat deposits than the length of the auger used (between 160 – 493 cm).
- Water table depth is a one time measurement. At sites with seasonally variable water tables this measurement reflects both the conditions that year, and the time of year.
- Redox features with deep depths typically indicate deeper peat deposits, which mask redox indicators so the depth corresponds to the peat thickness.
- pH and specific conductance measured in surface water or a shallow pit with a YSI 63 meter calibrated each sample.
- Plant Prevalence Index calculated based on Alaska indicator status downloaded from the USDA PLANTS database, which may use different values than the 1988 list.
Soils and Plant Communities
| Table 2. Common soils and plant communities found in Relict Glacial Lakebed wetlands. | ||
| Map Component | COMMON SOILS | COMMON PLANT COMMUNITIES |
LB2 |
STARICHKOF
HISTOSOLS |
Trichophorum caespitosum – Myrica gale |
LB3 |
STARICHKOF
HISTOSOLS |
Sphagnum spp. – Ericaceae |
LB4 |
STARICHKOF
HISTOSOLS |
Myrica gale – Dasiphora floribunda |
LB5 |
STARICHKOF
HISTOSOLS |
Calamagrostis canadensis / Betula nana |
LB6 |
STARICHKOF
HISTOSOLS |
Picea mariana / Ledum palustre ssp. decumbens
Picea mariana / Equisetum sylvaticum – Ledum palustre ssp. decumbens Picea x lutzii / Salix barclayi / Equisetum arvense / Empetrum nigrum |
| HISTOSOLS are any organic soils greater than 40 cm deep. | ||
Cation Chemistry
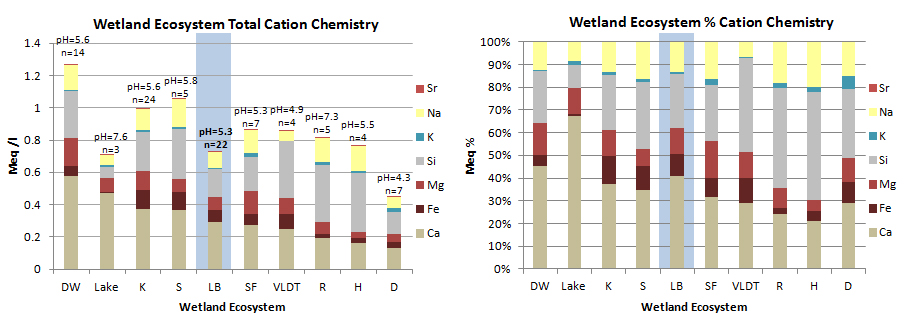
Cation chemistry by Wetland Geomorphic Component. Relict Glacial Lakebed wetlands (highlighted in blue) have low cation concentrations compared to other Geomorphic Components, indicating a strong precipitation influence on porewater chemistry. Cations that are present are contributed by groundwater discharge through underlying sediments. This discharge is spatially variable. Although calcium and silicon show the greatest concentrations, magnesium and iron concentrations in our area are high for natural waters. DW = Drainageway, K = Kettle; S = Discharge Slope; LB = Lakebed; SF = Spring Fen; RT = VLD Trough; R= Riparian; H = Headwater Fen; D = Depression.
Samples were collected from a surface pool where possible, otherwise from a separate shallow pit excavated to just below the water table. All samples were filtered through either a 0.2 micron filter using a disposable syringe, or pumped through a 0.45 micron filter using a peristaltic pump. Samples were acidified with ultra-pure nitric acid and kept cool until analysis on a direct current plasma spectrometer to about 5% accuracy (except K, 10-20% accuracy).
Relict Glacial Lakebed Hydrologic Components:
Map unit names are made of combinations of map components. A suffix ‘c’ indicates a created wetland, and a ‘d’ indicates a highly disturbed wetland.
LB1: Open water pond
- NWI: PEM2H
- HGM, LLWW: Terrene Flat groundwater-dominated Throughflow
LB2: Water table near the surface most of the growing season, often dominated by sedges.
- NWI: PEM1Eg
- HGM, LLWW: Terrene Slope/Flat groundwater-dominated Throughflow
LB3: Bogs, dominated by sphagnum moss and shrubs. Forested bogs are indicated by LB63 or LB36 map units, more extensive forests are mapped as LB63.
- NWI: PEM1/SS1,3&4Bg
- HGM. LLWW: Terrene Slope/Flat groundwater-dominated Throughflow
LB4: Dominated by shrubs, especially Labrador tea, leatherleaf and dwarf birch
- NWI: PSS1,3&4Bg
- HGM, LLWW: Terrene Slope/Flat groundwater-dominated Throughflow
LB5: Dominated by bluejoint reed grass, often over relatively shallow peat in areas with large amounts of local groundwater discharge.
- NWI: PEM1Bg
- HGM, LLWW: Terrene Slope/Flat groundwater-dominated Throughflow
LB6: Forested, typically by black spruce. When a forested bog the map unit is qualified by the LB3 component: LB63 are forested bogs.
- NWI: PFO4Bg
- HGM, LLWW: Terrene Slope/Flat groundwater-dominated Throughflow
LBSF: A complex of patterned fen with small high ridges (strangs) alternating with low pools or hollows (flarks) and bog islands which may or may not be forested.
- NWI: PEM1/SS1,3&4B&Eg
- HGM, LLWW: Terrene Slope/Flat groundwater-dominated Throughflow
| Table 3.Summary of Cook Inlet Relict Glacial Lakebed Map Unit occurrence. | ||||
| Map Unit | N | Hectares | % Polygons | % Area |
| LB1 | 88 | 649 | 0.37 | 0.35 |
| LB12 | 32 | 216 | 0.13 | 0.12 |
| LB13 | 2 | 5.3 | 0.01 | 0.00 |
| LB1-3 | 141 | 2268 | 0.59 | 1.21 |
| LB14 | 1 | 1.2 | 0.00 | 0.00 |
| LB1-4 | 40 | 1361 | 0.17 | 0.72 |
| LB1-5 | 1 | 9.8 | 0.00 | 0.01 |
| LB2 | 82 | 1849 | 0.76 | 0.98 |
| LB21 | 71 | 1055 | 0.30 | 0.56 |
| LB23 | 126 | 1496 | 0.52 | 0.80 |
| LB23d | 1 | 2.7 | 0.00 | 0.00 |
| LB24 | 142 | 1613 | 0.59 | 0.86 |
| LB2-4 | 114 | 1817 | 0.47 | 0.97 |
| LB2-4d | 1 | 1.6 | 0.00 | 0.00 |
| LB25 | 3 | 2.6 | 0.01 | 0.00 |
| LB2-5 | 4 | 46 | 0.02 | 0.02 |
| LB26 | 36 | 361 | 0.15 | 0.19 |
| LB2-6 | 9 | 150 | 0.04 | 0.08 |
| LB26d | 1 | 3.0 | 0.00 | 0.00 |
| LB2d | 4 | 7.4 | 0.02 | 0.00 |
| LB3 | 114 | 593 | 0.47 | 0.32 |
| LB31 | 5 | 14 | 0.02 | 0.01 |
| LB32 | 96 | 541 | 0.40 | 0.29 |
| LB34 | 126 | 673 | 0.52 | 0.36 |
| LB34d | 1 | 0.9 | 0.00 | 0.00 |
| LB36 | 60 | 450 | 0.25 | 0.24 |
| LB3-6 | 12 | 291 | 0.05 | 0.15 |
| LB3d | 1 | 3.5 | 0.00 | 0.00 |
| LB4 | 372 | 2194 | 1.55 | 1.17 |
| LB41 | 3 | 5.5 | 0.01 | 0.00 |
| LB42 | 95 | 1093 | 0.39 | 0.58 |
| LB43 | 122 | 1338 | 0.51 | 0.71 |
| LB45 | 6 | 65 | 0.02 | 0.00 |
| LB46 | 353 | 3428 | 1.47 | 1.83 |
| LB4-6 | 12 | 117 | 0.05 | 0.06 |
| LB5 | 7 | 16 | 0.03 | 0.01 |
| LB54 | 3 | 11 | 0.01 | 0.01 |
| LB56 | 3 | 17 | 0.01 | 0.01 |
| LB6 | 829 | 7348 | 3.45 | 3.91 |
| LB62 | 87 | 664 | 0.36 | 0.35 |
| LB63 | 159 | 674 | 0.66 | 0.36 |
| LB64 | 317 | 3512 | 1.32 | 1.87 |
| LB64d | 1 | 6.1 | 0.00 | 0.00 |
| LB65 | 1 | 19 | 0.00 | 0.01 |
| LB6d | 2 | 1.9 | 0.01 | 0.00 |
| LBSF | 158 | 5063 | 0.66 | 2.70 |