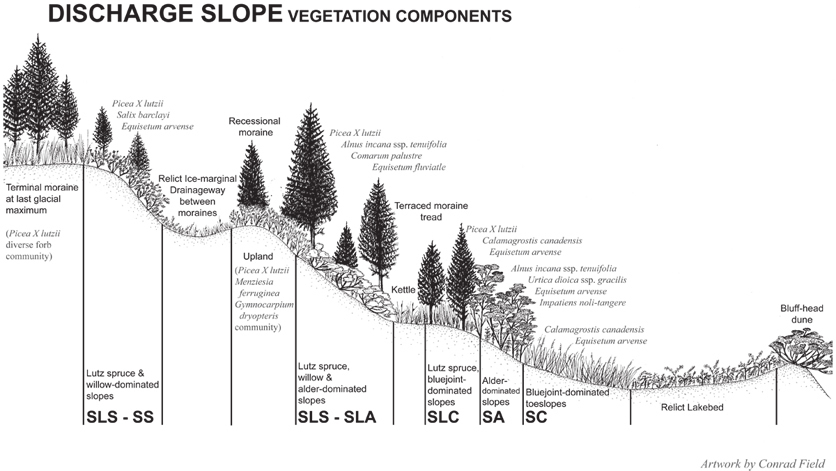
Mapping components of and common plants in Discharge Slope wetlands
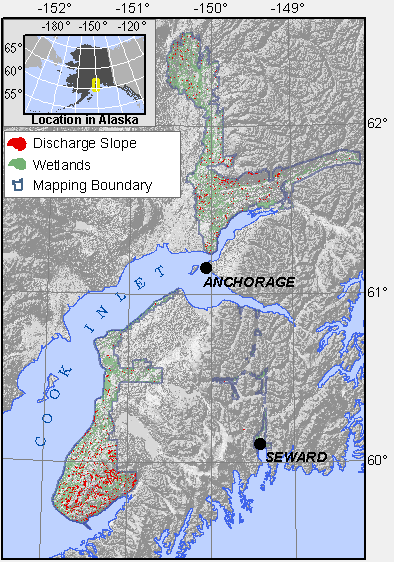
Occurrence of Discharge Slope wetlands in the Cook Inlet Lowlands Mapping Area
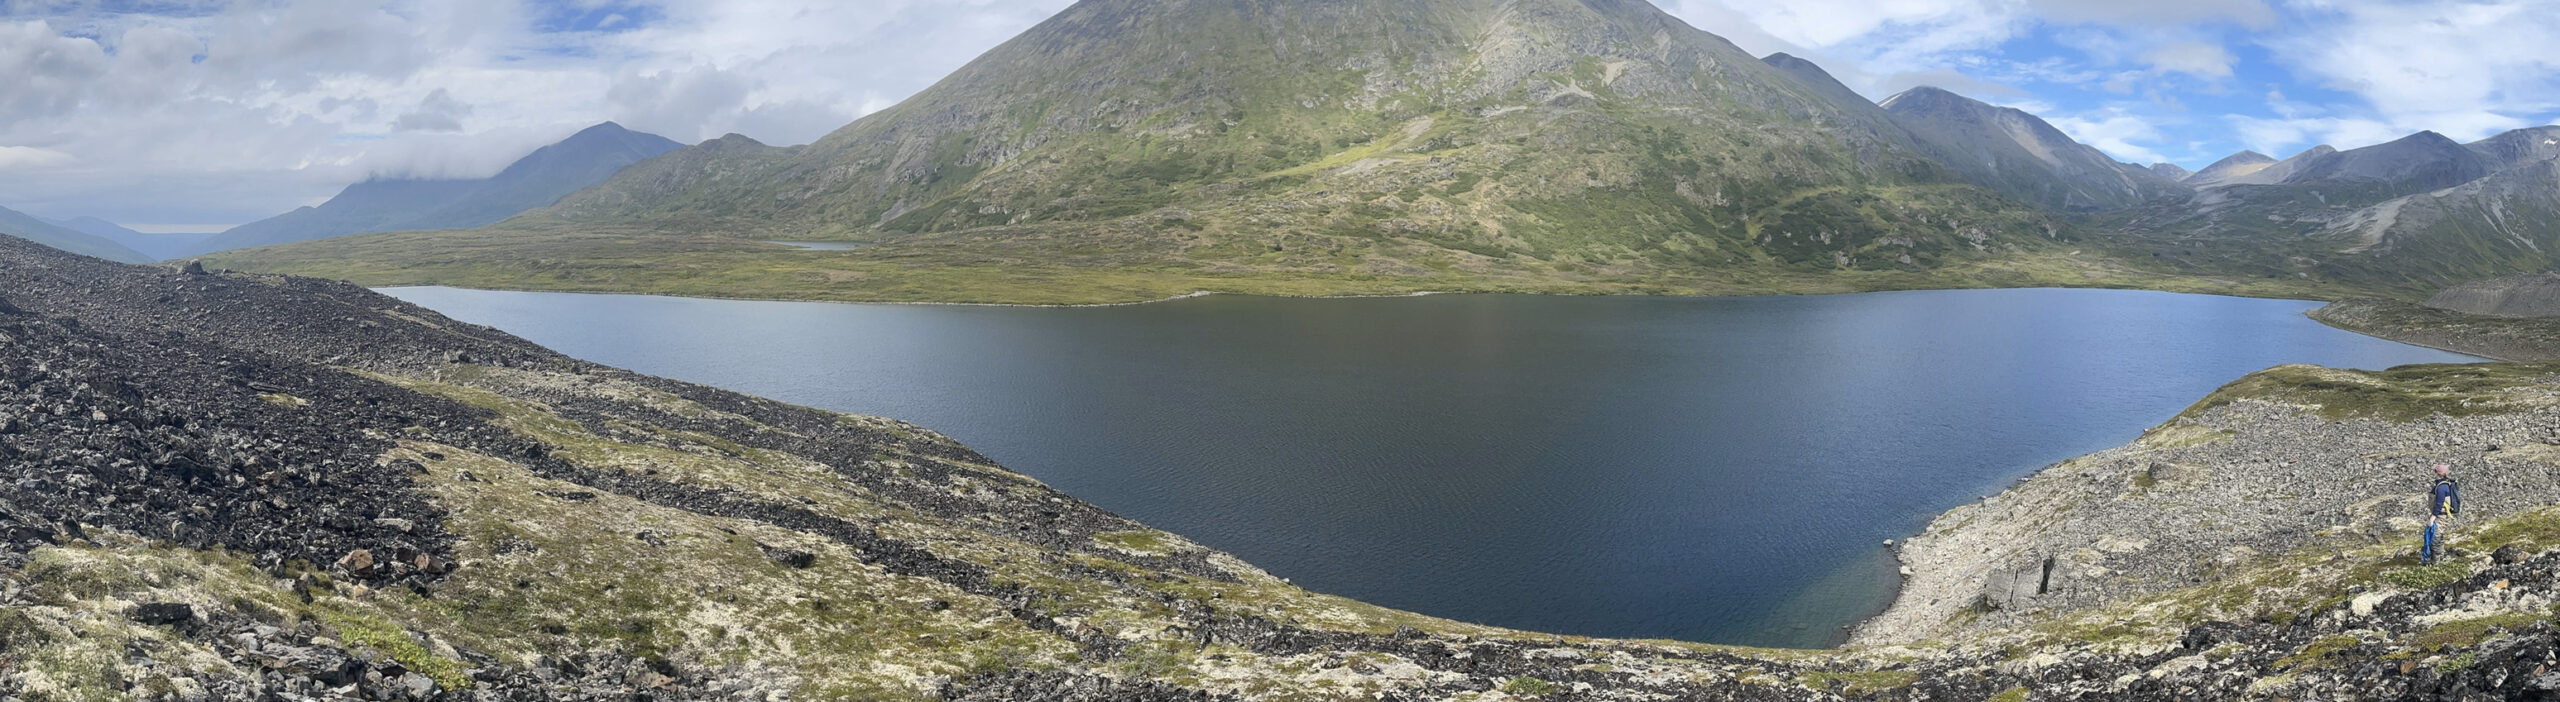
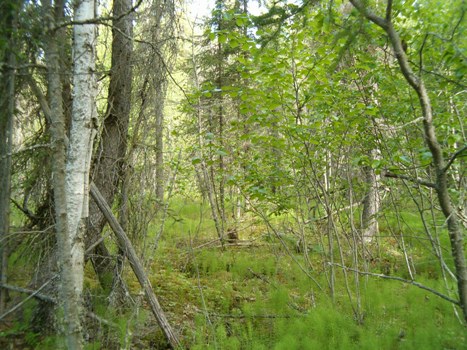
Discharge Slope wetlands occur over hydric mineral soils where shallow groundwater discharges at or near the surface. Discharge Slopes typically occur at the transition between wetland and upland where the boundary can be indistinct. These wetlands often support high water tables only seasonally, and therefore can be difficult to identify. Shallow groundwater wells in the Mat-Su Valley indicate that sites with late-season water tables deeper than 150 cm can support hydric conditions sufficient to meet wetland criteria (Clark, 1995). Discharge Slopes are the most extensive geomorphic type on the Kenai Peninsula, and a Discharge Slope dominated by Lutz spruce (Picea X Lutzii) is the most common mapping component there. Especially on the southern Kenai Peninsula, extensive deposits of glacial till, which is saturated, but slowly permeable, support Discharge Slopes (see map figure, above). The unsorted till is most prevalent as terraces along the western front of the Caribou Hills physiographic subdivision of Karlstrom (1964). In other areas of the Basin these till deposits are not so extensive, and can be more permeable.
 |
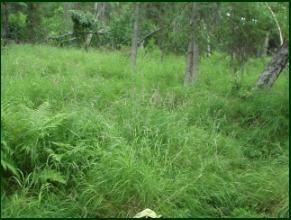 |
| Lutz spruce with Barclay’s willow and field horsetail at the margin of a small fen in the Caribou Hills. | A spruce and birch stand with a bluejoint – field horsetail understory on a kame toe slope in the Soldotna Creek watershed. |
 |
 |
| A thinleaf alder stand on a toe slope near the mouth of the Kenai River. | Lutz spruce with a rusty menziesia / field horsetail understory on a terrace riser foot slope above the large fen east of Anchor Point. |
Discharge Slope components are named after dominant plant species. Broad areas at the toe-slope position of the western margin of the Caribou Hills on the Kenai Peninsula are dominated by Lutz spruce and alder and support near-surface groundwater discharge. In the area between Palmer and Houston, Discharge Slopes are frequently forested with Alaska paper birch (Betula neoalaskana) and/or white spruce (Picea glauca) with an understory of field horsetail (Equisetum arvense). Although the indicator status of paper birch (B. papyrifera) has been changed to facultative in the Cook Inlet Lowlands, it likely does not occur there. However, Alaska paper birch (B. neoalaskana), which is probably the most common species in the region, is listed as facultative upland on the 2013 list of plant indicator status, along with white spruce and Lutz spruce (P. X lutzii), complicating wetland determinations on forested Discharge Slopes in the region. Further complications result because recent taxonomic changes suggest that much of the birch on the southern Kenai Peninsula is B. kenaica which has no status on the wetland plant indicator list (and therefore may be considered an upland plant). Good local knowledge, consideration of the position of the site in the surrounding landscape and augering to depth is sometimes required to accurately delineate these wetlands.
NWI and HGM
Discharge Slope wetlands are primarily classified in the US Fish and Wildlife Service National Wetlands Inventory (NWI) as forested palustrine wetlands (PFO). Forested wetlands were frequently overlooked on the NWI, which was mapped at 1:63,360. Shrub- and herbaceous-dominated Discharge Slopes are classified as PSS and PEM respectively.
The LLWW Hydogeomorphic classification of Tiner (2003) would classify most Discharge Slope wetlands as Terrene Slope groundwater-dominated Throughflow wetlands. If there is no wetland connected up slope, such as along upper terraces or stream valley walls, then they are Terrene Slope Outflow wetlands. A few have Paludified Slope wetland components, although paludification is uncommon, if present at all on the lowlands.
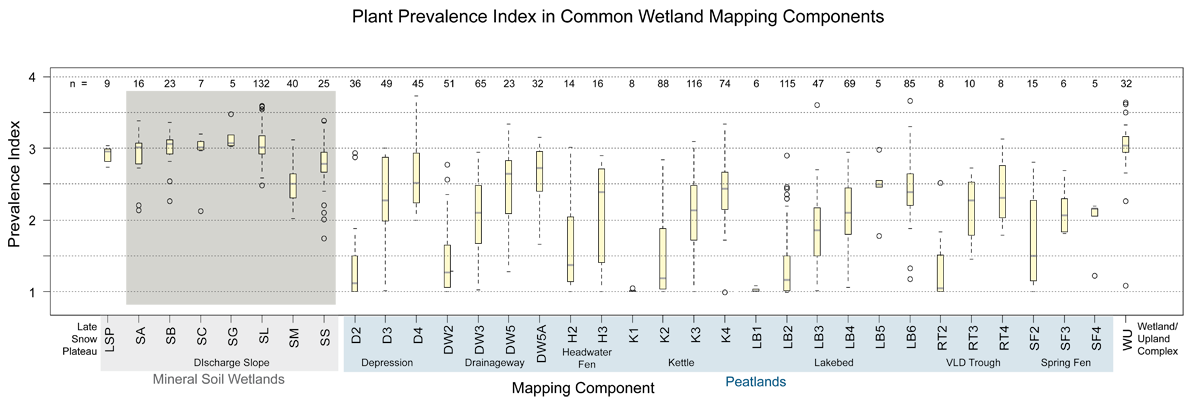
Box plots of Plant Prevalence Index (PI) in common wetland mapping components. Discharge Slope wetlands (highlighted in gray) exhibit uniformly high values for PI. Prevalence Index is calculated from the percent cover and the wetland indicator status of each plant found in a wetland plot. Lower values indicate a higher prevalence of plants assigned a wetland indicator status of obligate or facultative. Indicator status is assigned nationally, by state, and by regions within states. Prevalence Index may be a better descriptor of the variability of the water table than one-time measurements of the actual position of the water table. Measurements are often made before the water table has had time to fully equilibrate, and are dependent on antecedent conditions. However, if Indicator Status is accurately assigned the plants present will integrate long-term average conditions.
Although Prevalence Index is a good proxy for water table position and variability in many settings, PI may be a less reliable indicator on Discharge Slopes. Lower values of PI should indicate a water table closer to the surface for a longer portion of the growing season. For example, an Index value equal to one indicates that the plot supported only wetland obligate plants (occur in wetlands greater than 99% of the time under natural conditions) and a Prevalence Index value greater than 3 suggests that the plot may not be a wetland for jurisdictional purposes. Prevalence Index may not be as reliable an indicator of water table depth and variation in Discharge Slope wetlands because the bi-modal ecological distribution of many plants can complicate assignment of indicator status. For example, bluejoint reed grass and birch may grow over well-drained soils on south-facing slopes as well as on saturated toe-slopes at the margins of peatlands.. A single value for Prevalence Index is therefore impossible to assign for some plant species. The taxonomic changes discussed above further complicate accurate assignment of indicator status within regions.
However, box plots of water level measurements made during visits to Discharge Slope wetlands generally corroborate the PI values, showing that these wetlands most often occur at the transition between wetland and upland. Median water levels in Discharge Slope mapping components are often near 30 cm below the surface, the wetland cut-off.
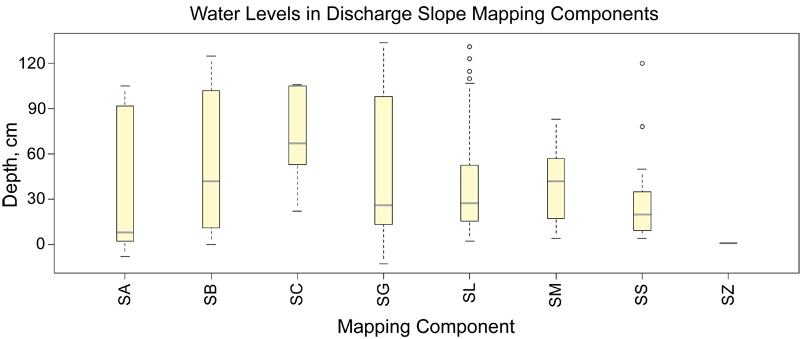
A= alder (n=10), B= birch (n=18), C= bluejoint reed grass (Calamagrostis canadensis) (n=5), G= White spruce (Picea glauca) (n=5), L= Lutz spruce (Picea x lutzii) (n=108), M= black spruce (Picea mariana) (n=26), S = willow (Salix spp.) (n=15), Z = a single high elevation meadow on the upper slopes of Baldy Ridge, above Wasilla in the Matanuska Valley.
Note however, that some deviations are apparent. Compare the PI values to depth at black spruce Discharge Slopes (SM), for example. PI is low, but water level measurements are relatively deep. Alder Discharge Slopes (SA) have a shallow median water level, yet median PI is near 3.
Because of these problems with water level variation at the wetland/upland transition, other factors such as slope, aspect, and elevation are more important in driving differences among Discharge Slope wetlands. By contrast, water level variability is very important in peatlands (highlighted in blue in the first graph). Because water level variation is less important in Discharge Slope wetlands, plant species dominance was chosen in place of a hydrologic component to distinguish mapping components. Within the hydrogeomorphic setting of discharge slopes, plant species probably best reflect unique combinations of environmental conditions in different wetlands.
In the box plots, yellow boxes enclose the first through third quartile (where 50% of the data values lie); the gray bar is the median, and the whiskers extend to the last value within 1.5 times the inner quartile range. Values lying beyond 1.5 times the inner quartile range are plotted as hollow circles. The number of samples for each map component is given across the top.
Box plots of specific conductance (SC- blue) and pH (brown) in the common geomorphic types. A few values for specific conductance greater than 300 micro-Siemens/cm are not shown. Discharge Slope wetlands (highlighted in gray) have the highest median values for both pH and specific conductance when compared to wetlands in other common geomorphic settings in Cook Inlet Basin. The high values indicate that that groundwater connections to the surface are relatively strong.
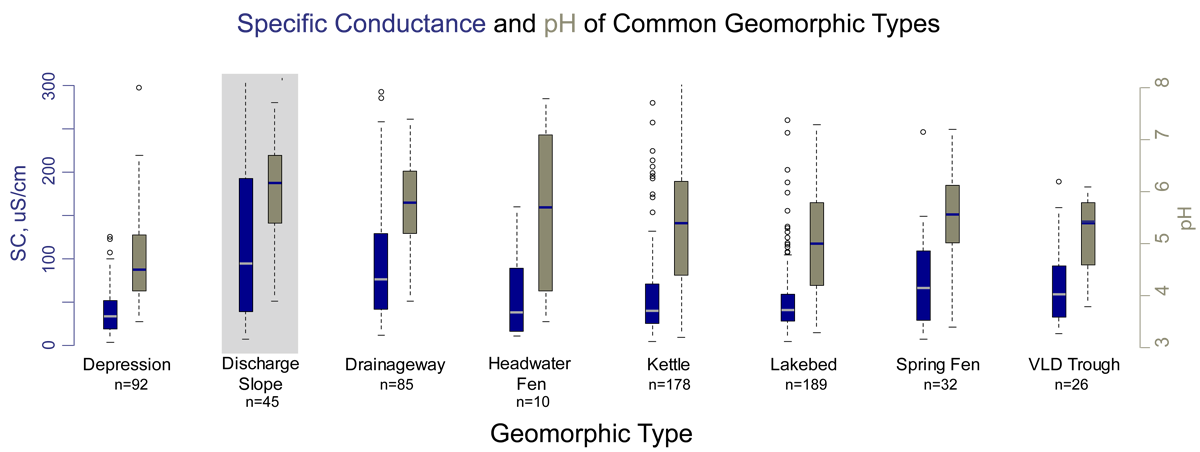
In box plots, the boxes enclose the first through third quartile (where 50% of the data values lie); the horizontal bar in the box is the median value, and the whiskers extend to the last value within 1.5 times the inner quartile range. Values lying beyond 1.5 times the inner quartile range are plotted as hollow circles.
Wetland Indicators
| Table 1. Wetland Indicators in Discharge Slope map components throughout the Cook Inlet Lowlands. | ||||||||
| Map Component | Peat Depth (cm) | Water Table (cm) | Redox features (cm) | Saturation (cm) | pH | Alkalinity mg/l as CaCO3 | Specific Conductance µS/cm | Plant Prevalence Index |
SA |
90 (16) | 26 (15) | 23 (6) | 3 (7) | 6.2 (8) | 39.0 (3) | 177 (5) | 2.92 (16) |
SB |
82 (19) | 54 (19) | 29 (15) | 42 (18) | 6.5 (10) | 61.6 (2) | 182 (9) | 2.99 (23) |
SC |
57 (7) | 71 (5) | 24 (6) | 7.0 (1) | 2.93 (7) | |||
SG |
20 (5) | 52 (5) | 14 (4) | 47 (4) | 5.7 (4) | 3.0 (1) | 75 (4) | 3.16 (5) |
SL |
31 (128) | 38 (108) | 26 (82) | 5.4 (9) | 4.8 (4) | 49 (2) | 3.05 (132) | |
SM |
46 (40) | 37 (32) | 34 (15) | 28 (24) | 5.4 (12) | 0.0 (4) | 62 (10) | 2.49 (40) |
SS |
43 (22) | 27 (18) | 28 (9) | 9 (3) | 6.7 (5) | 84.3 (4) | 259 (5) | 2.72 (25) |
SZ |
23 (1) | 1 (1) | 1 (1) | 6.0(1) | 18.4 (1) | 2.35 (1) | ||
Explanation:
- Numbers in parentheses indicate number of samples.
- Peat depth is a minimum, because some sites had thicker peat deposits than the length of the auger used (between 160 – 493 cm).
- Water table depth is a one time measurement. At sites with seasonally variable water tables this measurement reflects both the conditions that year, and the time of year.
- Redox features with deep depths typically indicate deeper peat deposits, which mask redox indicators so the depth corresponds to the peat thickness.
- pH and specific conductance measured in surface water or a shallow pit with a YSI 63 meter calibrated each sample.
- Plant Prevalence Index calculated based on Alaska indicator status downloaded from the USDA PLANTS database, which may use different values than the 1988 list.
Soils and Plant Communities
| Table 2. Common soils and plant communities found in Discharge Slope wetlands. | ||
| Map Component | COMMON SOILS | COMMON PLANT COMMUNITIES |
SA |
Typic Cryorthents | Alnus viridis ssp. sinuata / Equisetum arvense
Alnus viridis ssp. sinuata / Equisetum palustre Alnus incana ssp. tenuifolia / Calamagrostis Paper birch – White spruce / Thinleaf alder |
SB |
TYPIC CRYAQUENTS | Paper birch – White spruce / Thinleaf alder
Paper birch – Black spruce / Thinleaf alder |
SC |
BELUGA
Typic Cryorthents |
Calamagrostis canadensis – Equisetum arvense |
SG |
STARICHKOF
HISTOSOLS |
Paper birch – White spruce / Thinleaf alder |
SL |
STARICHKOF | Picea x lutzii / Salix barclayi / Calamagrostis canadensis
Picea x lutzii / Equisetum arvense – Calamagrostis canadensis |
SM |
HISTOSOLS | Picea mariana / Equisetum sylvaticum – Ledum palustre ssp. decumbens |
SS |
KILLEY | Salix barclayi / Rich
Salix barclayi / Calamagrostis canadensis – Equisetum arvense |
SZ |
CRYAQUEPTS | UNDEFINED |
| HISTOSOLS are any organic soils greater than 40 cm deep. | ||
Cation Chemistry
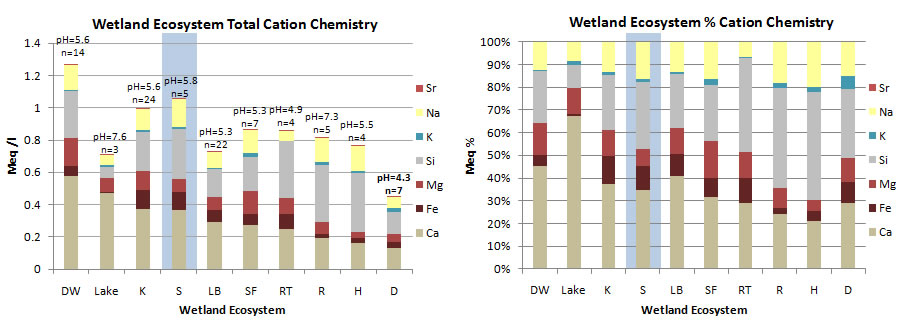
Cation chemistry by Geomorphic Component. Discharge Slope wetlands (highlighted in blue) have high cation concentrations compared to other Geomorphic Components. This indicates the strong groundwater discharge influence on porewater chemistry. Although calcium and silicon show the greatest concentrations, magnesium and iron concentrations in our area are high for natural waters. DW = Drainageway, K = Kettle; S = Discharge Slope; LB = Lakebed; SF = Spring Fen; RT = VLD Trough; R= Riparian; H = Headwater Fen; D = Depression.
Samples were collected from a surface pool where possible, otherwise from a separate shallow pit excavated to just below the water table. All samples were filtered through either a 0.2 micron filter using a disposable syringe, or pumped through a 0.45 micron filter using a peristaltic pump. Samples were acidified with ultra-pure nitric acid and kept cool until analysis on a direct current plasma spectrometer to about 5% accuracy (except K, 10-20% accuracy).
Discharge Slope Vegetation Components:
Map unit names are made of combinations of map components. A suffix ‘c’ indicates a created wetland, and a ‘d’ indicates a highly disturbed wetland.
SA: Dominated by alder, usually Alnus incana ssp. tenuifolia
- NWI: PSS1Bn,g
- HGM: Terrene Slope groundwater-dominated Throughflow
SB: Dominated by birch. Taxonomy of local birches is problematic; tree birches in this project have been designated Betula payrifera, realizing that B. Kenaica is widespread, and other taxa are probably present.
- NWI: PFO1Bn,g
- HGM: Terrene Slope Outflow
SC: Dominated by bluejoint reed grass (Calamagrostis canadensis).
- NWI: PEM1Bn,g
- HGM: Terrene Slope groundwater-dominated Throughflow
SG: Dominated by white spruce (Picea glauca); occurs primarily in the Matanuska Susitna Valley. Much of the spruce that is not black spruce (P. mariana) is Lutz spruce (Picea X Lutzii), a hybrid between the more continental white spruce and coastal Sitka spruce (P. sitchensis).
- NWI: PFO4Bn
- HGM: Terrene Slope Outflow
SL: Dominated by Lutz spruce (Picea X Lutzii), a hybrid between the more continental white spruce (P. glauca) and coastal Sitka spruce (P. sitchensis). Most common on the Kenai Peninsula, especially closer to maritime influence.
- NWI: PFO4,5Bn
- HGM: Terrene Slope Outflow, if adjacent to upland.
If wetlands above and below: groundwater-dominated Throughflow.
SM: Dominated by black spruce (Picea mariana).
- NWI: PFO4Bn,g
- HGM: Terrene Slope Outflow
SP: Dominated by Sitka spruce (Picea sitchensis), two wetland polygons in Seward.
- NWI: PFO4Bn
- HGM: Terrene Slope Outflow
SS: Dominated by willow, usually Barclay willow (Salix barclayi).
- NWI: PSS1Bn
- HGM: Terrene Slope groundwater-dominated Throughflow,
if wetlands above and below. If wetlands only below, then: Terrene Slope Outflow.
SZ: High elevation mountain meadows of various lush forb assemblages. Mapped only along the upper slopes on Baldy Ridge, above Wasilla.
- NWI: PEM1Bn
- HGM: Terrene Slope groundwater-dominated Throughflow
| Table 3.Summary of and Cook Inlet Discharge Slope Map Unit occurrence. | ||||
| Map Unit | N | Hectares | % Polygons | % Area |
| SA | 70 | 288 | 0.25 | 0.15 |
| SAB | 1 | 0.3 | 0.00 | 0.00 |
| SAC | 20 | 167 | 0.08 | 0.09 |
| SAG | 3 | 12 | 0.01 | 0.01 |
| SAL | 50 | 604 | 0.21 | 0.32 |
| SAM | 3 | 20 | 0.01 | 0.01 |
| SAS | 9 | 50 | 0.04 | 0.03 |
| SB | 90 | 991 | 0.37 | 0.53 |
| SBA | 4 | 19 | 0.02 | 0.01 |
| SBd | 3 | 7 | 0.01 | 0.00 |
| SBG | 7 | 14 | 0.03 | 0.01 |
| SBM | 10 | 295 | 0.04 | 0.16 |
| SC | 38 | 206 | 0.16 | 0.11 |
| SCA | 20 | 114 | 0.08 | 0.06 |
| SCAd | 5 | 9 | 0.02 | 0.00 |
| SCd | 3 | 0.6 | 0.01 | 0.00 |
| SCG | 2 | 2.7 | 0.01 | 0.00 |
| SCL | 10 | 63 | 0.04 | 0.03 |
| SCLd | 7 | 7.9 | 0.03 | 0.00 |
| SCS | 20 | 107 | 0.08 | 0.06 |
| SCSd | 1 | 24 | 0.00 | 0.01 |
| SG | 59 | 861 | 0.25 | 0.46 |
| SGA | 4 | 84 | 0.02 | 0.04 |
| SGB | 19 | 123 | 0.08 | 0.05 |
| SGC | 3 | 69 | 0.01 | 0.04 |
| SGM | 9 | 105 | 0.04 | 0.05 |
| SGS | 4 | 15 | 0.02 | 0.01 |
| SL | 1463 | 18,715 | 6.08 | 9.97 |
| SLA | 66 | 635 | 0.27 | 0.34 |
| SLC | 7 | 49 | 0.03 | 0.03 |
| SLCd | 2 | 2.1 | 0.01 | 0.00 |
| SLd | 6 | 37 | 0.02 | 0.02 |
| SLM | 58 | 447 | 0.24 | 0.24 |
| SLMd | 2 | 2.9 | 0.01 | 0.00 |
| SLS | 336 | 3164 | 3.18 | 2.53 |
| SLSd | 1 | 0.7 | 0.00 | 0.00 |
| SM | 765 | 4851 | 3.18 | 2.53 |
| SMA | 5 | 34 | 0.02 | 0.02 |
| SMB | 31 | 200 | 0.13 | 0.11 |
| SMC | 1 | 1.7 | 0.00 | 0.00 |
| SMd | 7 | 29 | 0.03 | 0.02 |
| SMG | 24 | 121 | 0.10 | 0.06 |
| SML | 42 | 340 | 0.17 | 0.18 |
| SMLd | 1 | 5.9 | 0.00 | 0.00 |
| SMS | 9 | 55 | 0.04 | 0.03 |
| SPS | 2 | 6.7 | 0.01 | 0.00 |
| SS | 315 | 1580 | 1.31 | 0.00 |
| SSA | 17 | 109 | 0.07 | 0.06 |
| SSC | 29 | 176 | 0.12 | 0.09 |
| SSG | 3 | 15 | 0.01 | 0.01 |
| SSL | 272 | 2149 | 1.13 | 1.14 |
| SSM | 13 | 63 | 0.05 | 0.03 |
| SZ | 20 | 214 | 0.08 | 0.11 |