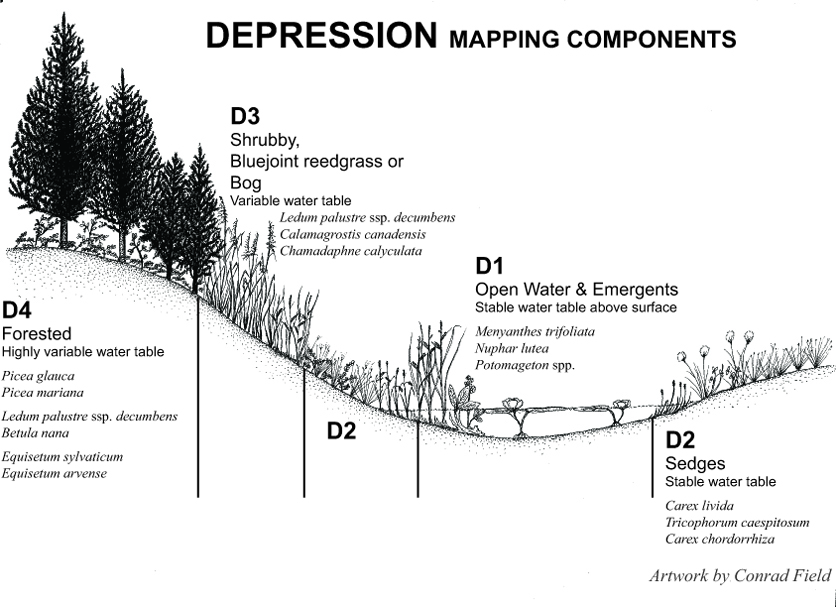
Mapping Components and plants in Cook Inlet Depressions

Occurrence of Depressions in Cook Inlet Lowlands Mapping Area
Depression wetlands are surrounded by uplands. These wetlands are commonly peatlands in ice-block depressions on large moraine complexes. They are also found on smaller moraines scattered throughout the lowlands, and on glacial outwash deposits around Palmer. Geomorphologically, Depression, Kettle, and Spring Fen Ecosystem wetlands are all “ice block depressions”. Ice-block depressions formed when large blocks of glacial ice melted. The blocks were entrained within the glacial till that was deposited at the last glacial maximum, around 8-15,000 years ago depending on the location. Some ice blocks were more isolated than others, and some were entrained in moraines, while others were entrained within glacial outwash sediments. The different names: Depression, Kettle and Spring Fen, help distinguish differences in wetland jurisdiction and ecosystem services occurring in this geomorphic setting.
Depression peatlands typically support lower pH and specific conductance values than Kettles or Spring Fens, indicating more bog-like, rather than fen conditions, especially west of Houston in the Matanuska-Susitna Valley. Bog conditions indicate that precipitation is a more important source of water to the wetland than groundwater. The low specific conductance values show that evaporative concentration is not a dominant process, so losses from the wetland must be to groundwater. Depressions are therefore probably controlled by a layer of low hydraulic conductivity and by the relatively low solar insolation reaching the bottom especially in smaller, steeper-sided Depressions. Together, these factors produce a micro-climate with lower outputs of incoming precipitation to evapotranspiration and deeper ground water. Very steep-sided depressions, such as those found in the Crevasse Moraine area, south of Palmer, can even support permafrost. At least 30 cm of hard ice was encountered 27 cm below the surface under a black spruce canopy in one Depression in the Crevasse Moraine area late in the season, on 21 August 2007. In less extreme cases, a deeper frost layer likely persists for an extended time into the growing season.
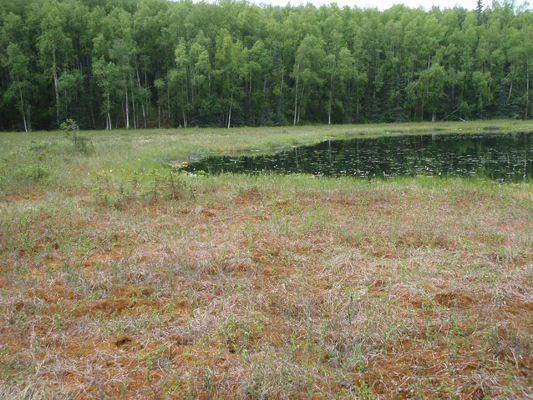
A Depression peatland dominated by Dwarf birch (Betula nana), fewflower sedge (Carex pauciflora) and Sphagnum fuscum on the pitted outwash surface west of Goose Bay State Game Refuge.
Depression Geomorphic components are similar to Spring Fen components because they are both small peatlands surrounded by uplands. However, Spring Fens are fed by stronger groundwater connections, thus have a less variable water table and correspondingly higher pH and specific conductance values indicating a more direct connection to shallow groundwater. Spring Fens are found only in the lowlands between Palmer and Wasilla, where potential evapotranspiration exceeds precipitation, and underlying glacial outwash deposits are well-sorted and highly permeable. The rate of groundwater flow through this area has been found to be very high. Depression wetlands are also similar to Kettle wetlands, but Kettles have a wetland or surface water connection to a navigable waterbody. Kettles are peatlands with generally weaker connection to groundwater than Spring Fens, and lie in areas where precipitation exceeds evapotranspiration.
Hydrologic Function
By definition Depressions are disconnected from surface water, therefore they are connected to streams only through ground water. Because losses roughly balance inputs over longer time scales (the wetland is neither rapidly filling nor draining), and water chemistry indicates that evaporative concentration is not occurring, Depressions must function to recharge groundwater. Depressions are also very effective at storing precipitation and contributing (ground water) discharge to watershed elements lying down gradient. These storage and contributing functions help regulate natural stream flow regimes by attenuating peak flows during storms and snowmelt and contributing flow through ground water during dry periods. If Depressions become more connected to surface water, for example by projects that would fill these wetlands with relatively impermeable material, then these recharge, storage, contributing, and regulating functions will be lost. Water will flow overland off the site rather than being stored and then slowly released through underlying aquifers to wells and streams.
NWI and LLWW
Depression wetlands fall into the US Fish and Wildlife Service’s National Wetlands Inventory Palustrine category. Depressions support a variety of Classes from herbaceous emergents (PEM) to shrubs (PSS) and forest (PFO). The forested subclass is usually needle-leaved evergreen, but occasionally it is mixed needle-leaved evergreen / broad-leaved deciduous. The shrub subclass is usually a mix of broad-leaved deciduous and evergreen. Hydrologic regimes are generally saturated (B) although seasonally flooded/saturated conditions are typical of the PEM subclass (PEME). The hydrologic regime in the forested subclass often does not fit any of the NWI regimes very well because PFOs in Depressions rarely support standing surface water, and are only saturated to the surface for a sufficient time during the growing season to meet wetland conditions. Due to the short growing season in Cook Inlet Basin, this period of saturation may be only for a few weeks. The NWI hydrologic regime “saturated” requires saturation to the surface for “extended periods during the growing season”. The water chemistry modifier in Depressions is usually acidic and the soils modifier is almost always organic.
The LLWW Hydrogeomorphic classification of Tiner (2003) would place Depression wetlands into its Terrene Basin Isolated wetland category.
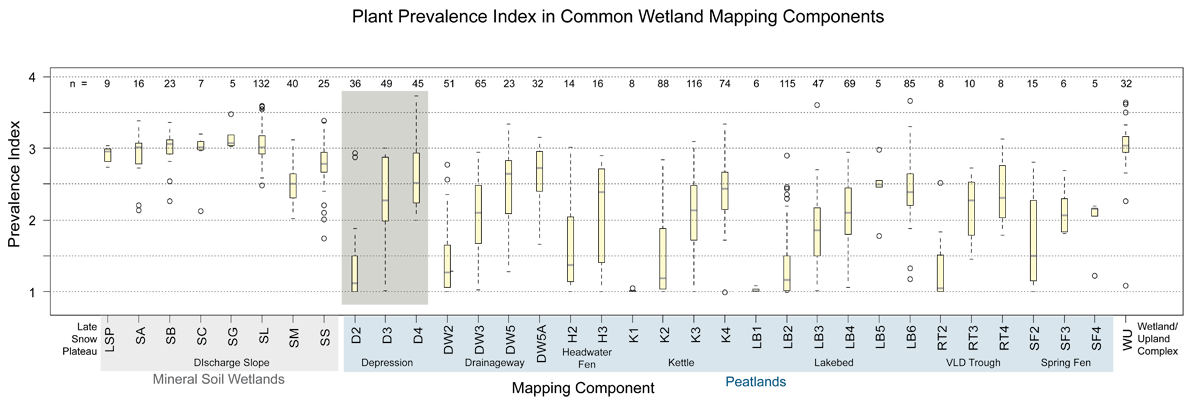
Box plots of Plant Prevalence Index (PI) in common wetland mapping components. Depression wetlands (highlighted in gray) mapped with lower hydrologic component values (D2 vs. D4 for example) have lower values for Plant Prevalence Index. Prevalence Index is a good proxy for water table position and variability. Lower values indicate a water table closer to the surface for a longer portion of the growing season. An Index value equal to one indicates that the plot supported only wetland obligate plants (occur in wetlands greater than 99% of the time under natural conditions). A Prevalence Index value greater than 3 suggests that the plot may not be a wetland for jurisdictional purposes. The Depression wetlands we sampled never had PI values greater than 3 unless they were forested. The Depressions mapped as D3, which are generally shrubby, although sometimes they are dominated by bluejoint reed grass, show generally higher Index values than in other geomorphic types mapped with the hydrologic component 3. The higher values probably correspond to weaker ground water discharge, which would provide a steadier supply of water, to D3 wetlands.
Prevalence Index is calculated from the percent cover and the wetland indicator status of each plant found in a wetland plot. Lower values indicate a higher prevalence of plants assigned a wetland indicator status of obligate or facultative. Indicator status is assigned nationally, by state, and by regions within states. Prevalence Index may be a better descriptor of the variability of the water table than one-time measurements of the actual position of the water table. Measurements are often made before the water table has fully equilibrated, and are dependent on antecedent conditions. However, if Indicator Status is accurately assigned the plants present will integrate long-term average conditions.
In the box plots, yellow boxes enclose the first through third quartile (where 50% of the data values lie); the gray bar is the median, and the whiskers extend to the last value within 1.5 times the inner quartile range. Values lying beyond 1.5 times the inner quartile range are plotted as hollow circles. The number of samples for each map component is given across the top.
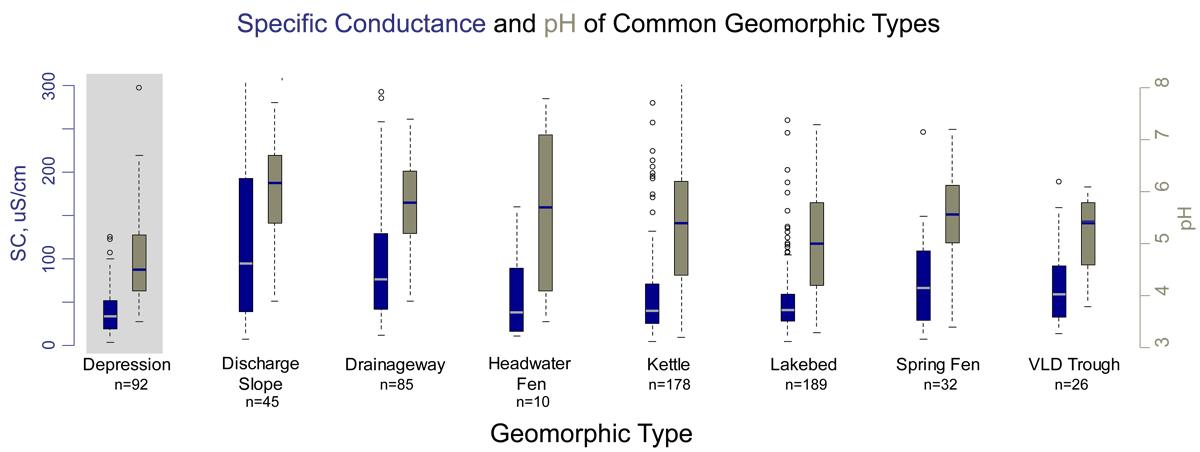
Box plots of specific conductance (SC- blue) and pH (brown) in the common geomorphic types. A few values for specific conductance greater than 300 micro-Siemens/cm are not shown. Depression wetlands (highlighted in gray) have generally lower pH and specific conductance when compared to wetlands in other common geomorphic settings in Cook Inlet Basin. The low values indicate that bogs are forming in many Depressions, and/or that groundwater connections to the surface are relatively weak.
In box plots, the boxes enclose the first through third quartile (where 50% of the data values lie); the horizontal bar in the box is the median value, and the whiskers extend to the last value within 1.5 times the inner quartile range. Values lying beyond 1.5 times the inner quartile range are plotted as hollow circles.
Table 1. Wetland Indicators of Depression map components in the Cook Inlet Lowlands.
| Table 1. Wetland Indicators of Depression map components in the Cook Inlet Lowlands. | ||||||||
| Map Component | Peat Depth (cm) | Water Table (cm) | Redox features (cm) | Saturation (cm) | pH | Alkalinity mg/l as CaCO3 | Specific Conductance µS/cm | Plant Prevalence Index |
D1 |
-136 (1) | 0 (5) | 5.4 (17) | 1.6 (11) | 16 (20) | 1.46 (2) | ||
D2 |
220 (34) | 1 (36) | 0.3 (30) | 4.5 (29) | 0.2 (25) | 38 (28) | 1.31 (36) | |
D3 |
178 (50) | 14 (40) | 67 (4) | 8 (39) | 4.4 (29) | 0.8 (23) | 48 (30) | 2.29 (49) |
D4 |
135 (44) | 30 (37) | 35 (10) | 9 (27) | 4.6 (15) | 0.7 (12) | 52 (15) | 2.57 (45) |
Explanation:
- Numbers in parentheses indicate number of samples.
- Peat depth is a minimum, because some sites had thicker peat deposits than the length of the auger used (between 160 – 493 cm).
- Water table depth is a one time measurement. At sites with seasonally variable water tables this measurement reflects both the conditions that year, and the time of year. Negative values are for water levels above the surface
- Redox features with deep depths typically indicate deeper peat deposits, which mask redox indicators so the depth corresponds to the peat thickness.
- pH and specific conductance measured in surface water or a shallow pit with a YSI 63 meter calibrated each sample.
- Plant Prevalence Index calculated based on Alaska indicator status downloaded from the USDA PLANTS database, which may use different values than the 1988 list.
Soils and Plant Communities
| Table 2. Common soils and plant communities found in Depression wetlands. | ||
| Map Component | COMMON SOILS | COMMON PLANT COMMUNITIES |
D2 |
STARICHIKOF
HISTOSOLS |
Sphagnum spp. – Carex chordorrhiza
Dwarf birch / Rannoch rush |
D3 |
HISTOSOLS | Calamagrostis canadensis – Equisetum arvense |
D4 |
HISTOSOLS | Picea mariana / Ledum palustre ssp. decumbens
Picea mariana / Equisetum sylvaticum – Ledum palustre ssp. decumbens |
| HISTOSOLS are any organic soils greater than 40 cm deep. | ||
Cation Chemistry
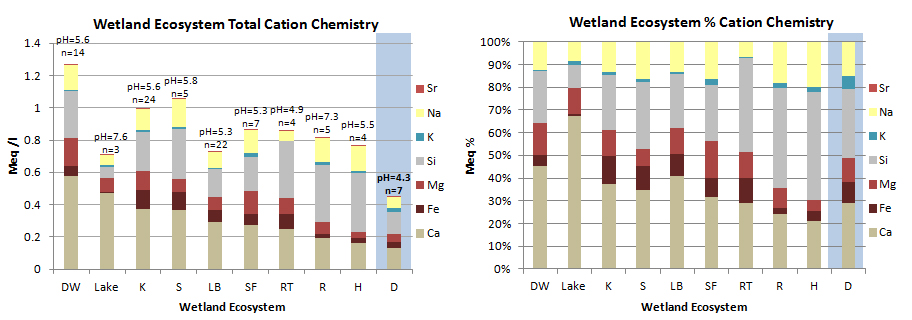
Cation chemistry by Geomorphic Component. Depression wetlands (highlighted in blue) have the lowest cation concentrations, indicating a strong precipitation source, and less groundwater influence than other Geomorphic Components. Although calcium and silicon show the greatest concentrations, magnesium and iron concentrations in our area are high for natural waters. DW = Drainageway, K = Kettle; S = Discharge Slope; LB = Lakebed; SF = Spring Fen; RT = VLD Trough; R= Riparian; H = Headwater Fen; D = Depression.
Samples were collected from a surface pool where possible, otherwise from a separate shallow pit excavated to just below the water table. All samples were filtered through either a 0.2 micron filter using a disposable syringe, or pumped through a 0.45 micron filter using a peristaltic pump. Samples were acidified with ultra-pure nitric acid and kept cool until analysis on a direct current plasma spectrometer to about 5% accuracy (except K, 10-20% accuracy).
Depression Wetland Hydrologic Components:
Map unit names are made of combinations of map components. A suffix ‘c’ indicates a created wetland, and a ‘d’ indicates a highly disturbed wetland.
D1: Ponds in Depressions.
- NWI: PEM
- HGM, LLWW: Terrene Basin Isolated
D2: Depressions with water table near the surface most of the growing season. Often dominated by sedges, dwarf birch and/or sweetgale.
- NWI: PEM1F
- HGM, LLWW: Terrene Basin Isolated. When adjacent to a central lake: Lentic Fringe Isolated.
D3: Depressions with fluctuating water table, often dominated by shrubs.
- NWI: PSS1,3&4B
- HGM, LLWW: Terrene Basin Isolated
D4: Depressions with deeper, fluctuating water table, forested.
- NWI: PFO4B
- HGM, LLWW: Terrene Basin Isolated
| Table 3. Summary of Cook Inlet Depression Map Unit occurrence. | ||||
| Map Unit | N | Hectares | % Polygons | % Area |
| D1 | 193 | 868 | 0.59 | 0.46 |
| D12 | 37 | 237 | 0.15 | 0.13 |
| D13 | 21 | 75 | 0.09 | 0.04 |
| D1-3 | 135 | 365 | 0.56 | 0.19 |
| D1-3c | 1 | 1.6 | 0.00 | 0.00 |
| D14 | 3 | 4.6 | 0.01 | 0.00 |
| D1-4 | 41 | 92 | 0.17 | 0.05 |
| D1c | 14 | 3.7 | 0.06 | 0.00 |
| D1d | 1 | 0.5 | 0.00 | 0.00 |
| D2 | 236 | 209 | 0.98 | 0.11 |
| D21 | 43 | 54 | 0.18 | 0.03 |
| D21c | 1 | 0.5 | 0.00 | 0.00 |
| D23 | 301 | 360 | 1.25 | 0.19 |
| D23d | 1 | 2.2 | 0.00 | 0.00 |
| D24 | 6 | 8.3 | 0.02 | 0.00 |
| D2-4 | 105 | 160 | 0.44 | 0.09 |
| D2d | 1 | 8.8 | 0.00 | 0.00 |
| D3 | 552 | 566 | 2.29 | 0.03 |
| D31 | 1 | 0.2 | 0.00 | 0.00 |
| D32 | 176 | 278 | 0.73 | 0.15 |
| D32c | 1 | 0.7 | 0.00 | 0.00 |
| D32d | 1 | 2.4 | 0.00 | 0.00 |
| D34 | 286 | 480 | 1.19 | 0.26 |
| D34d | 1 | 3.4 | 0.00 | 0.00 |
| D3d | 7 | 5.9 | 0.03 | 0.00 |
| D4 | 504 | 1082 | 2.10 | 0.58 |
| D42 | 14 | 30 | 0.06 | 0.02 |
| D43 | 208 | 396 | 0.86 | 0.21 |
| D4d | 6 | 12 | 0.02 | 0.01 |